Tuesday, July 30, 2013
Reviewing the Arduino with Analog Pressure Sensor Data
The picture above is the majority of "p.alpha.2", my second prototype... looks a bit jumbled no?
Well there's really not much to it as of yet, it's simply an Arduino Lilypad USB with the "Boston" pressure sensor leading into one of the analog ports.
I used a basic voltage splitter configuration similar to the following circuit but with the sensor at R1, a 2700 ohm resistor at R2 and roughly the 3 volts coming from the USB supply.
This configuration generated what looked to me to be pretty nice data when tested across a range of weight and with repetitive motion.
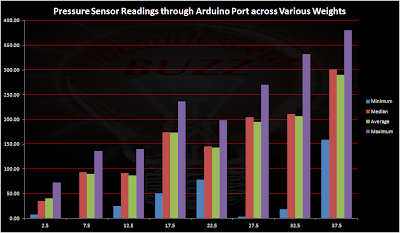
The following charts display the data received from the Arduino (from the Serial Monitor) across a range of weights.
Notice that for each chart, the red line is a smoothed 11 point moving average that clearly shows the repetitive motions executed during each test even for the more volatile readings at the lower end of the weight range.
Another point to make clear is that there were less repetitive motions using the heavier weight simply as a result of fatigue and is not an artifact of the metering process itself.
Note too that the smoothed data also remained relatively stable during each test with readings in fairly distinct ranges while the top chart displaying the Minimum, Median, Average and Maximum values read for each raw series.
Looking at the data from a software development perspective, I think that each individual series looks very stable and distinct, a good finding that likely means that interpreting these data will be fairly straight forward.
Best to all...
Subscribe to:
Post Comments (Atom)


No comments:
Post a Comment